Global Biomanufacturing Trends, Capacity, and Technology Drivers: Industry Biomanufacturing Capacity Overview
全球生物药制造的趋势、 : 行业产能概述
Posted: June 30, 2017
发布时间
Patti Seymour
Dawn M. Ecker
BioProcess Technology Consultants
原文链接
Abstract
摘要
Biologic-based drugs are an increasingly important part of the product growth strategies for pharmaceutical and biopharmaceutical companies. As the number of commercial products and pipeline candidates grows, a crucial issue facing the industry is the current and future state of biomanufacturing capacity, the availability of that capacity, and the technologies impacting upstream and downstream bioprocessing. Pharmaceutical and biopharmaceutical companies and contract manufacturing organizations (CMOs) are aligning their strategies to not only address capacity but to address greater complexity in supplier risk and the adoption of advanced biomanufacturing technologies.
以生物技术为基础的药品是传统制药和生物制药公司成长战略中越来越重要的部分
Biopharmaceutical products have rapidly become a larger percentage of overall pharmaceutical company revenue with sales of the top six selling antibody products, Humira, Remicade, Enbrel, Rituxan, Avastin, Herceptin, at just over $51B in 2015. The compound annual revenue growth rate for antibody products, which includes antibody conjugates, naked antibodies, and antibody fusion proteins, from 2003 to 2014 was 21%; however, this growth is expected to slow to the high teens in the coming years due to the maturation of many products, and emerging alternative technologies. Also, it is more difficult to sustain such growth rates the larger the market becomes.
生物药产品占整个制药公司收入的比例正在迅速增加
To provide context about this growing segment of the market, BPTC estimates that there are over 900 biopharmaceutical products in some stage of clinical development in the United States or Europe, and the large majority of these products, 77%, are produced in mammalian cell culture systems. To further refine the biopharmaceutical manufacturing market, we evaluated the distribution of mammalian products by product type and phase of development. Figure 1 shows the distribution of the following product types, antibody products (which include naked monoclonal antibodies, Fc-fusion proteins, antibody fragments, bispecific, antibody conjugates, and other antibody-related products), blood proteins, cytokines, enzymes, fusion proteins, hormones and other recombinant proteins, by phase of development. Antibody products are the dominant product type for all phases of development, but this product type is even more dominant for early phase products. Antibody products comprise nearly half, 48%, of currently marketed products. Recall that many of the early commercial biopharmaceutical products, such as growth hormones, insulins and interferons, are produced in microbial systems, but the use of microbial production systems is much less common now. The percentage of antibody products currently in the BLA, or equivalent, stage of regulatory submission is 67% (BLA/MAA stage in Figure 1). Antibody products make up 82% of products in Phase 3 development and 90% of products in Phase 1 and 2 development.
BPTC推算了这一不断增长的细分市场的状态
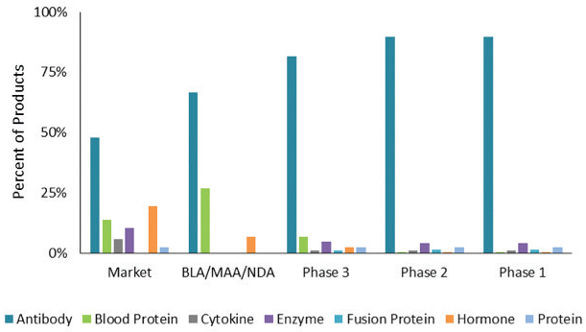
Figure 1. Distribution of Mammalian Products by Product Type and Phase of Developmen
图1. 哺乳动物细胞培养系统的产品类型和研发阶段的分布
Whether approved or in development, all of these products need access to mammalian production capacity. To better understand the production requirements needed to meet the demand for all of these products, we created a demand forecast. The future demand for current commercially approved biopharmaceutical products is estimated from each product
无论已获批上市还是仍处于研发阶段
Using the sales growth data along with the number of patients treated in the current year (based on price per mg and sales), an estimated treatment population for future years can be calculated for each year during the forecast period. This forecasted treatment population, combined with the yearly per patient dosing calculates the kilogram quantities of each product that will be required in future years. These forecasted product quantities along with an estimated expression level and overall yield estimates for each product can then be used to calculate the estimated amount of cell culture capacity (L/yr) that will be required for each product in future years.
使用销售增长的数据以及当年治疗的患者数量
Figure 2 shows the forecasted kilogram quantities of product needed to meet annual commercial demand for all products types produced using mammalian production systems. In 2014, approximately 13 metric tons of product are needed, and the large majority of the demand is for currently commercial products (teal band). The orange band labeled Clinical on each bar represents an estimate of clinical trial material manufactured to support the clinical development of all pipeline product candidates in a given year. The green band, present but not visible in the 2016 bar, represents products that have submitted a BLA, or equivalent, and are estimated to receive regulatory approval and enter the commercial market in 2016. The cycle time of 1 to 1.5 years from submission of BLA to approval is based on industry standard product development success rates. Similarly, the grey band first appearing in the 2017 bar represents products in Phase 3 clinical development in 2014 that are projected to receive regulatory approval and begin entering the commercial market in 2017. This grey band increases each year as the commercial demand for the products grows. The purple band and the light blue band represent the products in Phase 2 and Phase 1 development, respectively, that are forecasted to begin entering the commercial market in 2018 and 2019, respectively. As more products receive commercial approval each year, the overall kilogram requirements needed to meet commercial product demand increase from just over 13 metric tons in 2014 to nearly 40 metric tons in 2020.
图2显示了使用哺乳动物细胞系统生产可供满足所有产品类型所需的预测千克数
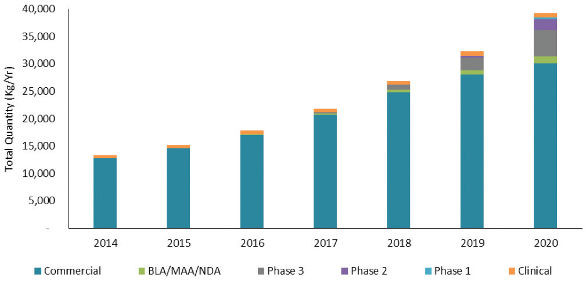
Figure 2. Forecast of Bulk Kilograms Needed to Meet Product Demand
图2. 满足需求的千克数的预测
Another way to view the total production capacity needed to meet product demand between 2014 and 2020 is to think of the demand in terms of total installed volume of mammalian cell culture capacity. Figure 3 shows the volumetric capacity required to support the clinical development and eventual commercial sales of all current pipeline product candidates in the year shown. An estimation of yield is required to go from kilogram demand to liter demand and introduces some uncertainty in the forecast due to the fact that most companies do not publish their production yields. For this reason, our analysis uses industry average estimates. As described for annual kilogram demand in Figure 2, each bar represents the volume required for those products in the indicated phase of development in 2014 that successfully reach the commercial market. In 2014, the annual volumetric requirements were just over 1,600 KL, while in 2020, the volumetric requirements will be just over 3,400 KL.
评估2014年至2020年间满足所有产品所需的总产能的另一种方法是考虑哺乳动物细胞培养在容积上的需求
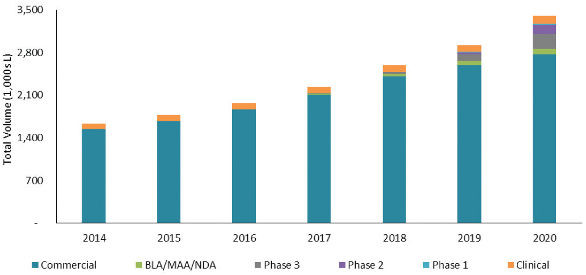
Figure 3. Forecast of Volumetric Capacity Needed to Meet Product Demand
图3. 满足需求的容积的预测
Given this increase in volumetric demand over the next 5 years, the industry is concerned about the availability of production capacity. There is always some degree of uncertainty in balancing the demand and supply equation due to production problems, market demand over time and competitive factors. As shown in Figure 4, in 2016, the available mammalian cell culture supply is currently approximately 3,600 KL and is projected to grow to approximately 5,600 KL by 2021. However, not all capacity is equally available throughout the industry. In 2016, Product companies (companies focused on product development) hold approximately 73% of the installed mammalian cell culture capacity, while Excess companies (companies that are developing products, but also sell or make available any excess manufacturing capacity) and CMOs control significantly less capacity, 13% and 14%, respectively. The forecasted distribution of capacity changes only slightly in 2021, with Product companies holding 68% of the installed capacity, while CMO companies increase to 15% and Excess companies increase to 17% of the capacity.
鉴于未来5年对产能的需求增加
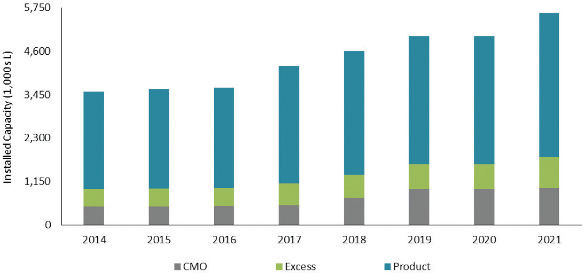
Figure 4. Current Mammalian Manufacturing Capacity
图4. 哺乳动物细胞培养系统的产能
When comparing clinical versus commercial capacity, it is evident that the total volume of capacity devoted to commercial manufacturing far exceeds that devoted to clinical production. In 2016, nearly 390 KL (11%) of capacity are designated for clinical manufacturing compared to nearly 3,250 KL (89%) for commercial products. In 2021, percentages do not change, with approximately 600 KL of clinical capacity and just over 5,000 KL for commercial capacity. This is not surprising because of the relatively small demand for clinical supply in comparison to the larger demand for commercial sale.
比较用于临床试验与商业制造的产能
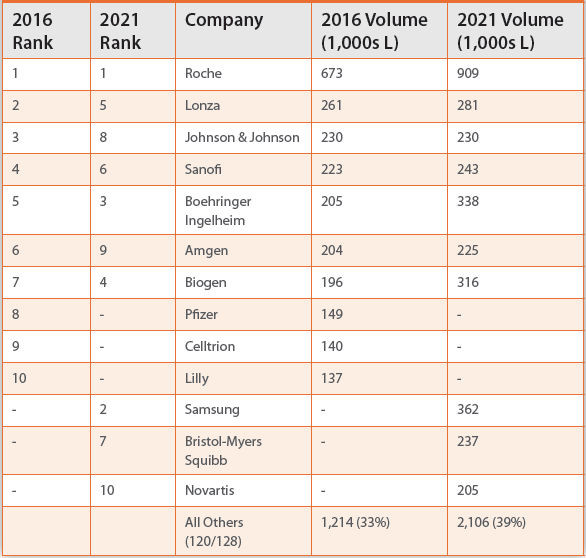
While Product companies control the majority of cell culture capacity, capacity is highly concentrated among ten companies. Table 1 shows the distribution of capacity among the top ten capacity holders in a given year. Capacity for companies not ranked in the top 10 are included in the
商业产品公司控制着大部分细胞培养能力
Table 1. Capacity Control
表1. 各公司对产能的控制
Geographic distribution of capacity may also skew the accessibility to capacity. Figure 5shows in 2016, North America holds the greatest percentage of capacity (52%), followed by Europe (32%) and Asia (16%). In 2021, the order remains the same but the percentages change slightly – North America (42%), Europe (34%) and Asia (24%). There has been significant growth of capacity in Asia, particularly in Korea and Singapore, due to government incentives and tax advantages. Asian locations for manufacturing also tend to be more attractive to companies with mature pipelines and the ability to manage complex global supply chains.
产能的地理分布也可能会影响其可及性
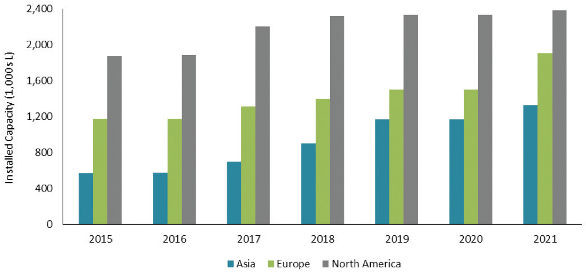
Figure 5. Geographic Distribution of Capacity
图5. 产能的地理分布
Irrespective of ownership or geographic location, there is a surplus of capacity as shown in the balance between a demand for mammalian cell culture and total available capacity in Figure 6. The light grey band in each bar represents the remaining available capacity. This analysis assumes an average capacity utilization of 18 batches per bioreactor per year. The demand for manufacturing capacity has been adjusted forward one year to account for the fact that bulk product is typically made well ahead of actual sales, on which demand calculations are based. For the majority of products sold in 2014, for example, bulk drug substance was manufactured in 2013.
无论产能的所有权或地理位置如何
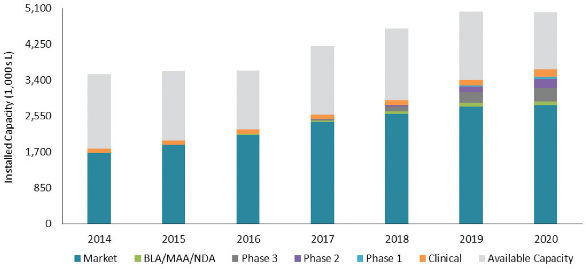
Figure 6. Overall Industry Supply and Demand Balance
图6. 总体产能和需求对比
Our analysis shows there is currently sufficient mammalian cell culture capacity world-wide to meet the total industry demand and that in 2014, only 50% of industry-wide cell culture capacity was utilized. This analysis of capacity utilization also indicates that while manufacturing capacity in general is projected to grow in the coming years, the demand for capacity will grow at a slightly greater rate so that by 2020 industry-wide capacity utilization will increase to 73%. At this anticipated level of utilization in 2020, some companies are likely to be challenged meeting the demand for specific products or gaining access to capacity at CMOs.
我们的分析表明
A utilization rate of 50% may give the appearance that the industry is not currently operating at
目前50%的利用率可能会让人产生该行业的产能没有被
As with any forecasting model, our assumptions are based on the mostly probable scenarios. However, if biopharmaceuticals being developed for certain large patient population indications such as Alzheimer
与任何预测模型一样
Conversely, there are other manufacturing trends that will result in a lesser demand for some biopharmaceuticals, such as the increased focus on orphan drugs and a shift from full length naked antibodies to alternative antibody formats and more potent products, i.e., Antibody Drug Conjugates (ADCs), which would require lower doses, that in turn, would reduce the demand for manufacturing capacity.
相反
As the biopharmaceutical industry has grown, the industry has built a certain type of capacity to meet the demands for the top six selling antibody products. The 2014 kilogram demand for each of the top six selling antibody products was >0.75 metric tons for a total 8.5 metric tons. The demand for all other antibody products combined was approximately 4 metric tons. The forecasted demand for approximately 70% of new products approved between 2016 and 2020 is expected to be less than 100 kg per year per product with the exception of Alzheimer
随着生物制药行业的发展
Table 2. Number of Product Demand Met by Bioreactor Scale
表2. 商业化的产品对不同容积的生物反应器的需求数量

Overall, the biopharmaceutical industry is expected to continue to have strong growth for the foreseeable future, and antibody products will be the dominant driver of this growth. Installed capacity is currently able to meet the manufacturing demand for these products, but control and location of capacity can affect how accessible certain capacity is. The majority of capacity is product based, as opposed to CMO based, making it difficult for companies without capacity to access it at the right time and under the right conditions. North America has the greatest percentage of installed capacity, but Asia has seen a surge in new capacity installation. To meet increased product demand, installed capacity is forecasted to increase from approximately 3.6 ML in 2016 to approximately 5.6 ML in 2021. While capacity will increase, demand for capacity will increase at an even faster rate potentially resulting in capacity shortages by 2021. We have noted that the industry is already experiencing some capacity constraints at the clinical scales due to very high clinical demand. The type and scale of capacity being installed will also be important as the demand for 50% of products in mid-to-late stage development can be met with 5,000L of capacity or less; while the other 50% of products will need larger, and potentially much larger, capacity to meet future demand. How the industry responds to these demands for capacity will certainly be critically important to ensure these products are available to the patients.
总体而言
References
参考资料
Ecker DM, Ransohoff TC, Jones SD, Levine HL. The state of mammalian cell culture biomanufacturing. Woburn (MA): BioProcess Technology Consultants, Inc.; 2011 Dec 12. 150 p. Available from: AK, Reichert JM. Recombinant protein therapeutics-success rates, market trends and values to 2010. Nat Biotechnol. 2004 Dec;22(12):1513-9.DiMasi JA, et al. Trends in risks associated with new drug development: success rates for investigational drugs. Clin Pharmacol Ther. 2010 Mar;87(3):272-7.
Author Biographies
作者简历
Patricia Seymour, M.B.A., CSCP, is a Senior Consultant with BioProcess Technology Consultants and has over 25 years of experience in the biotechnology industry. Her expertise spans the development and commercialization spectrum, including biologics and small molecule development, quality, regulatory and manufacturing, supply chain strategy, and management and operations leadership. Ms. Seymour was formerly Sr. Director, Global Investigational Supply Operations at Millennium. She previously held positions at Covance, Collaborative BioAlliance, ImmunoGen, Dana Farber Cancer Institute and Sloan Kettering. Ms. Seymour received her B.S. from Villanova University and her M.B.A. from Boston University and is a Certified Supply Chain Professional (APICS).
Dawn M. Ecker, M.S., is a consultant with BioProcess Technology Consultants, and has 25 years of experience in the biotechnology industry. At BPTC she is responsible for maintaining the company
译者

0
推荐
 京公网安备 11010502034662号